 ebman Available
A k9s-style terminal UI for AWS Elastic Beanstalk.
Triage red environments, stream logs, diff and edit config, run SSM sessions and ship new versions — all from the keyboard. If you’ve used k9s, the muscle memory carries: : for commands, / to filter, Enter to drill in, ? for help.
Or don’t drive by hand at all — ebman mcp serve gives your coding agent the whole fleet over MCP. It reads what’s wrong at a glance, and with your confirm, fixes it.
First line installs ebman; the second wires it into Claude Code. On a different MCP client? Run ebman mcp setup — it prints the exact registration for you. On Homebrew 6 or newer, run brew trust tombaldwin/tap first.
No Elastic Beanstalk fleet to hand? ebman --demo runs it against a synthetic one, with no AWS calls.
macOS · Apple Silicon macOS · Intel Linux · x86_64
v0.45.2 · View on GitHub · open source, MIT / Apache-2.0
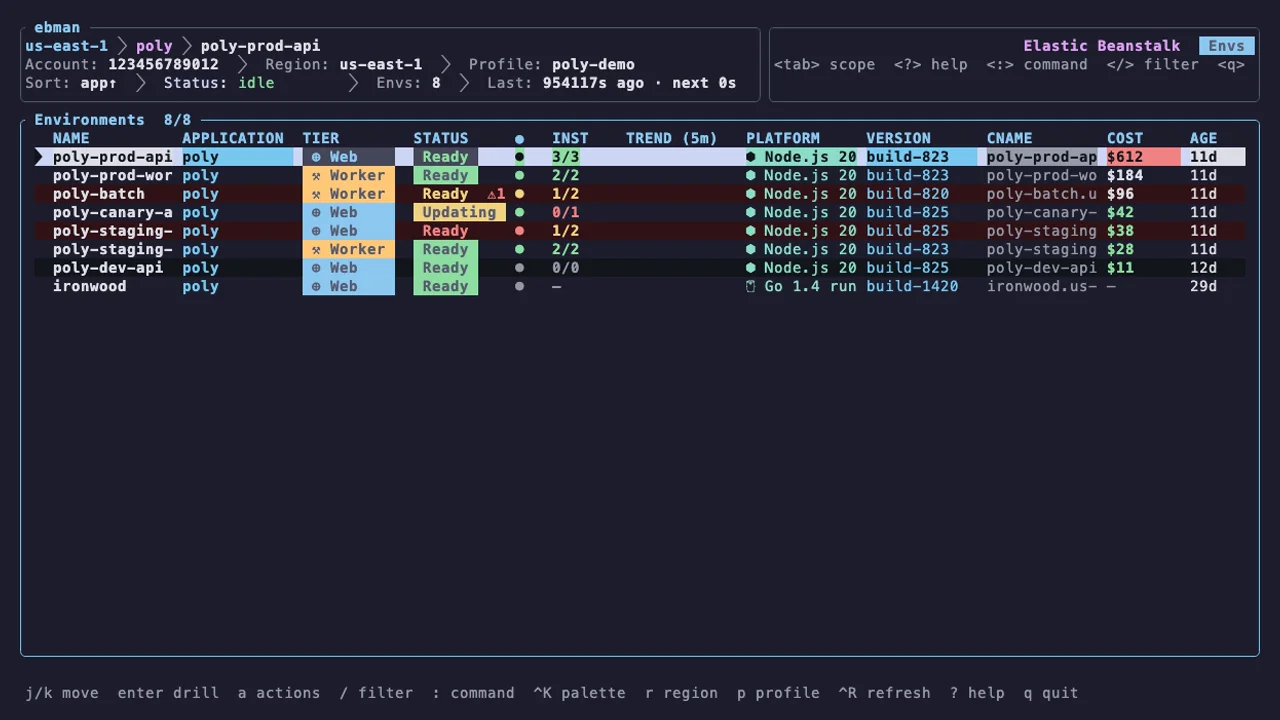
The live environment table — status, health, versions and cost across the whole fleet, sortable and filterable. Drill into any env, or hit :why on a red one.
From red to fixed in five keystrokes
Production goes red at 3am. From your terminal:
ebman— launch;prod-apishows up tinted red in the table.- /
prod-api↵ — jump straight to it. - :why — recent events, alarms, instance health and last deploys, all in one overlay.
- :diff
prod-api staging-api— confirm staging is still on the previous version. - :rollback — redeploy the last-known-good version label, with a five-second undo window.
Every action and its outcome lands in ~/.cache/ebman/audit.log. The AWS-console alternative is a minimum of five page-loads, two tabs, and zero audit trail.
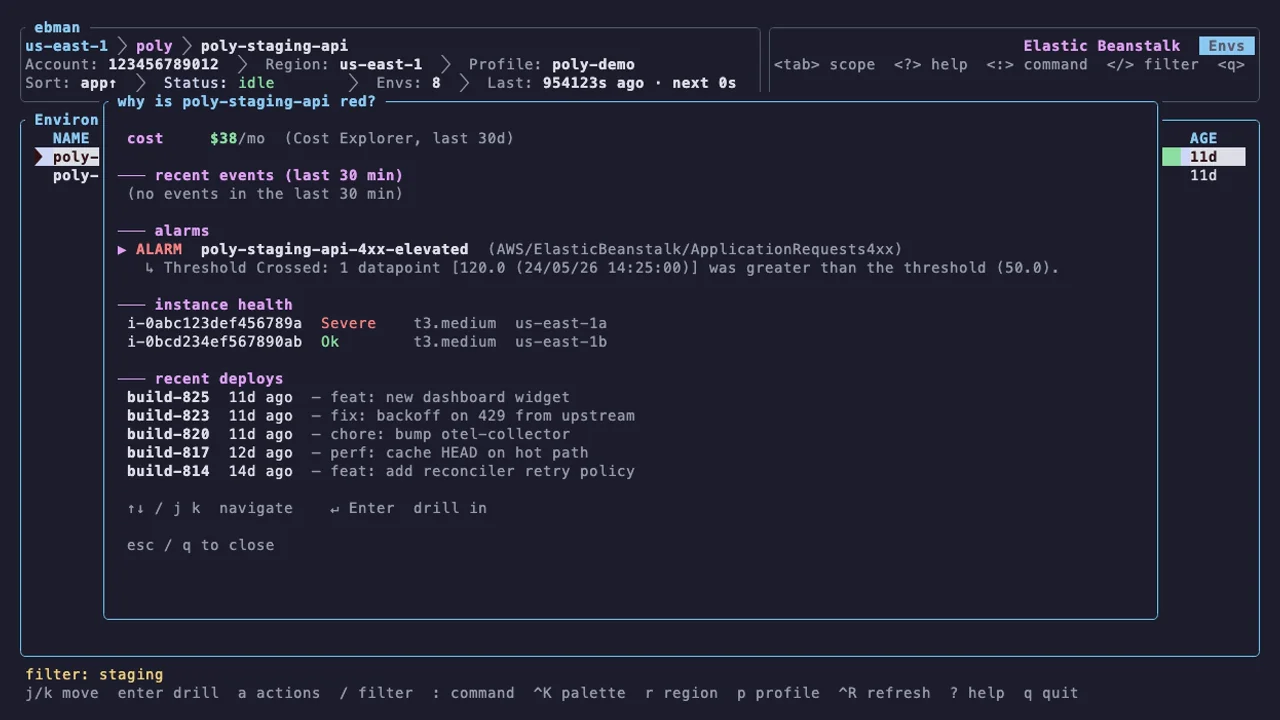
:why on a red env: recent events, alarms, instance health and the last few deploys — one screen, no console tabs.
What’s inside
- Agent-native (MCP)
ebman mcp serveexposes the fleet to Claude Code and other MCP clients — read tools for envs, lint, drift, config and cost.--allow-writesadds opt-in two-phase deploys: the tool returns a plan, a human sees it, then a confirm dispatches — behind the same pins, read-only and cross-process incident freeze. - Live environment table Sort, filter, group by app, health sparklines and severity tints across every env — with mouse support.
- One-screen triage :why gathers recent events, alarms, instance health and last deploys into a single overlay, with a DLQ peek for worker envs.
- Health up front Alarms in ALARM, DLQs with a backlog and stale platforms surface on the row itself — not three tabs deep.
- Forensics :diff option-setting deltas between envs, :lineage for the deploy timeline, :alarm-history for CloudWatch state changes.
- Daily-driver writes Env vars, tags, deploys (label, local zip or S3, with
--preview), saved configs, alarms and capacity — behind typed-name confirms. - Multi-account & scriptable Parallel queries across regions and
AssumeRoleaccounts, plus--read-only, a full audit log and a headlessebman ctl/--jsoninterface for CI.
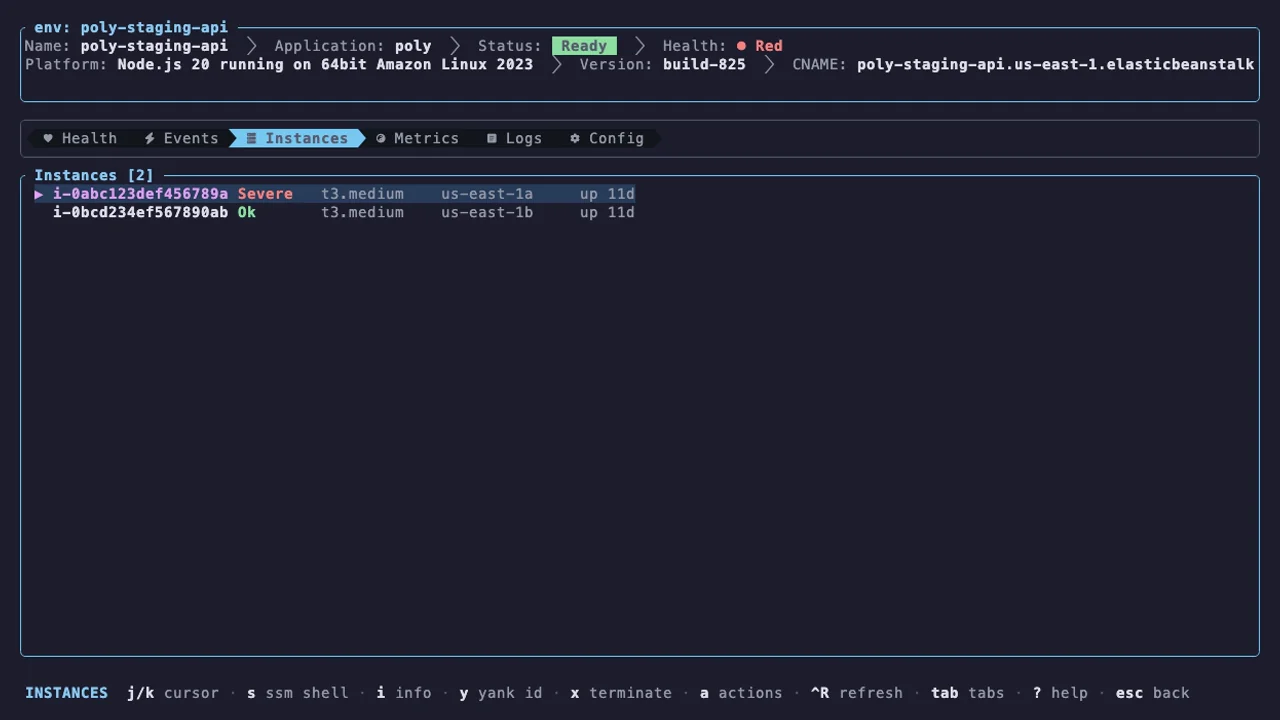
Drill into any env — here the Instances tab, with per-instance health, type and AZ. Tabs for Health, Events, Metrics, Logs and Config, plus :ssh for an embedded SSM session.
Hand the whole fleet to your coding agent
ebman ships an MCP server, so Claude Code — or any MCP client — reads your Elastic Beanstalk fleet as first-class tools instead of shelling out to aws elasticbeanstalk and re-parsing JSON. It sees what’s red, what drifted, what changed and the per-env cost in one query. Reads are on by default; writes are opt-in, and every write is two-phase — the tool returns a plan, a human approves it, then it dispatches — behind the same safety pins, read-only and incident freeze the TUI honours.
Two commands, and everything’s local and inspectable — nothing fetched or auto-run. Install ebman, then let it print the exact MCP registration for your client (Claude Code, Cursor, VS Code…):
On Claude Code you can skip straight to claude mcp add ebman -- ebman mcp serve. Hand your agent the commands to run if you like — they’re plain commands you can read first, and the agent fetches nothing on its own. Add --allow-writes for opt-in two-phase writes; full tool list in docs/headless.md. ebman is listed in the MCP Registry as io.github.tombaldwin/ebman.
Why ebman? How it compares with the EB CLI
You probably already use one of these — here’s where each falls short for daily Elastic Beanstalk triage:
| Tool | Good at | Where it falls short |
|---|---|---|
| AWS Console | Approachable, complete UI. | Eventually-consistent state, and at least five page-loads across two tabs to triage and fix one env. Painful at 3am. |
The EB CLI (eb) | A single project’s deploy flow. | No multi-env view, no live drill-down, no diff between envs, no DLQ workflow. |
aws elasticbeanstalk | Raw, scriptable API access. | You build the workflow out of --query / jq pipelines yourself. |
| k9s + EKS | The pattern ebman is modelled on. | Doesn’t exist for Elastic Beanstalk. |
ebman is k9s-for-EB: keyboard-driven, drill-down-first, one screen for ‘what’s wrong’ and ‘what changed’ — built for operators who triage red envs daily and don’t want the console round-trip.
Install
Homebrew (macOS / Linux):
Homebrew 6 and newer ask you to trust a third-party tap before installing from it: run brew trust tombaldwin/tap first.
Cargo:
Or grab a pre-built binary — macOS (Apple Silicon / Intel) and Linux x86_64, with checksums, from the Releases page (the download buttons at the top point at the latest). ebman uses the standard AWS credential chain (AWS_PROFILE / ~/.aws/credentials, instance role).
Have a system to build, or one that needs work?
Get in touch